Graphic-Report
Extract Daily Recording Summaries and Cosinor Parameters
C. William Yao
Source:vignettes/Graphic-Report.Rmd
Graphic-Report.RmdWhat will be covered in this tutorial?
This specific tutorial is designed to show users how to generate a graphic/text report of daily actigraphy measures. For details on data harmonization and the analysis of daily actigraphy measures, please see the Time-Shift tutorials.
Step 0: Pre-requisits
For this tutorial, it is essential that the recording be properly
pre-processed (i.e., adjusted for time shifts due to travel or daylight
saving). If this step has not been done, please go to the tutorial
titled Time-Shift. Note that while the tutorial uses adjusted
data affected by multiple sources of time shift, the same procedure can
be used for any longitudinal recording, even if the recordings are not
affected by time shift. See example in ?write.act.
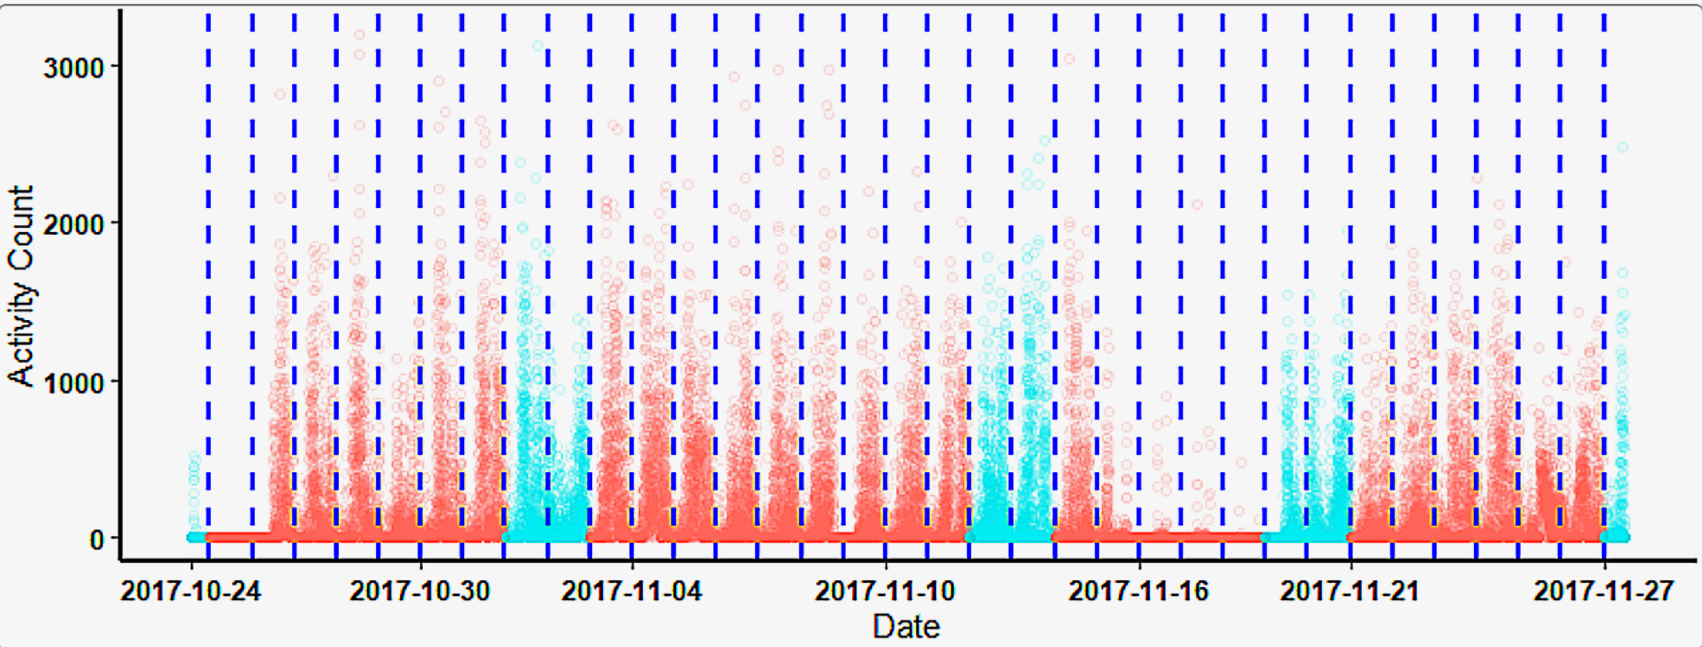
An example of the adjusted longitudinal recording.
Step 1: Segment Daily Recordings
To segment the recording by day, ActiGlobe uses
Act2Daily() to segment the data. This will require users to
provide the BriefSum() report and the recording. Since some
may wish to modify the default column names, users will have to provide
the names of the columns containing the activity count and time
(generated by BriefSum()). Note that we can skip step 1 if
we want to save daily recordings and review the pre-processed recordings
directly from PDF.
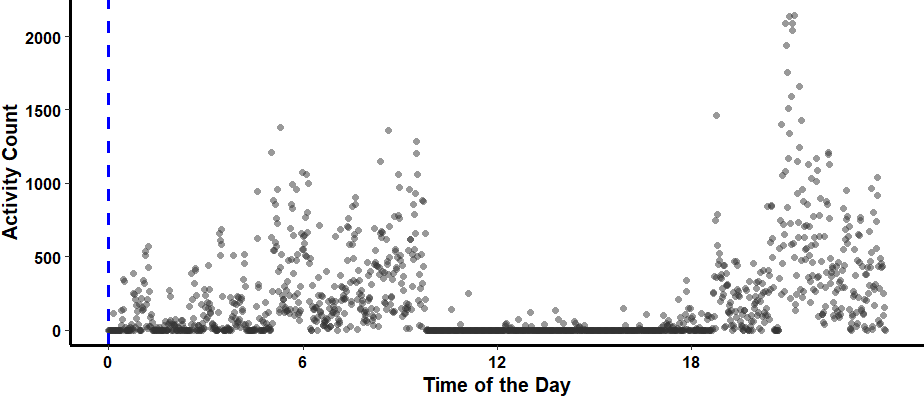
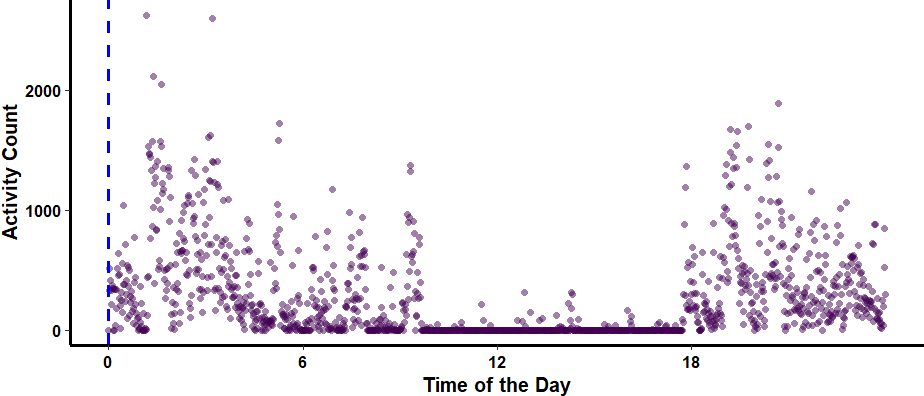
Visual Example of Segmented Daily Recording
### Here, we selectively generate graphs at random for day 11 and day 12.
for (i in names (dfList$Daily_df) [11:12]) {
    ggActiGlobe (
        df = dfList$Daily_df [[i]],
        Bdf = Bdf.adj,
        VAct = "Activity",
        VDT = "DateTime"
    ) +
        scale_color_grey () #### Change the graph colour
}
Step 2: Export Daily Recordings
Once the recordings are segmented, we can export daily recordings
using the write.act() function, which internally calls
Act2Daily(). If the goal is simply to segment data and
create quick summaries for documentation or other purposes, we can
bypass Act2Daily() altogether. However, for best practice,
especially when handling many recordings, it is advisable for users to
review some recordings with Act2Daily() during
processing.
dfList <- write.act (
    Dir = "The_PATH_in_the_computer_WHERE_the_daily_recordings_will_be_stored",
    ID = "JD",
    df = df,
    Bdf = Bdf.adj,
    VAct = "Activity",
    VTm = "Time"
)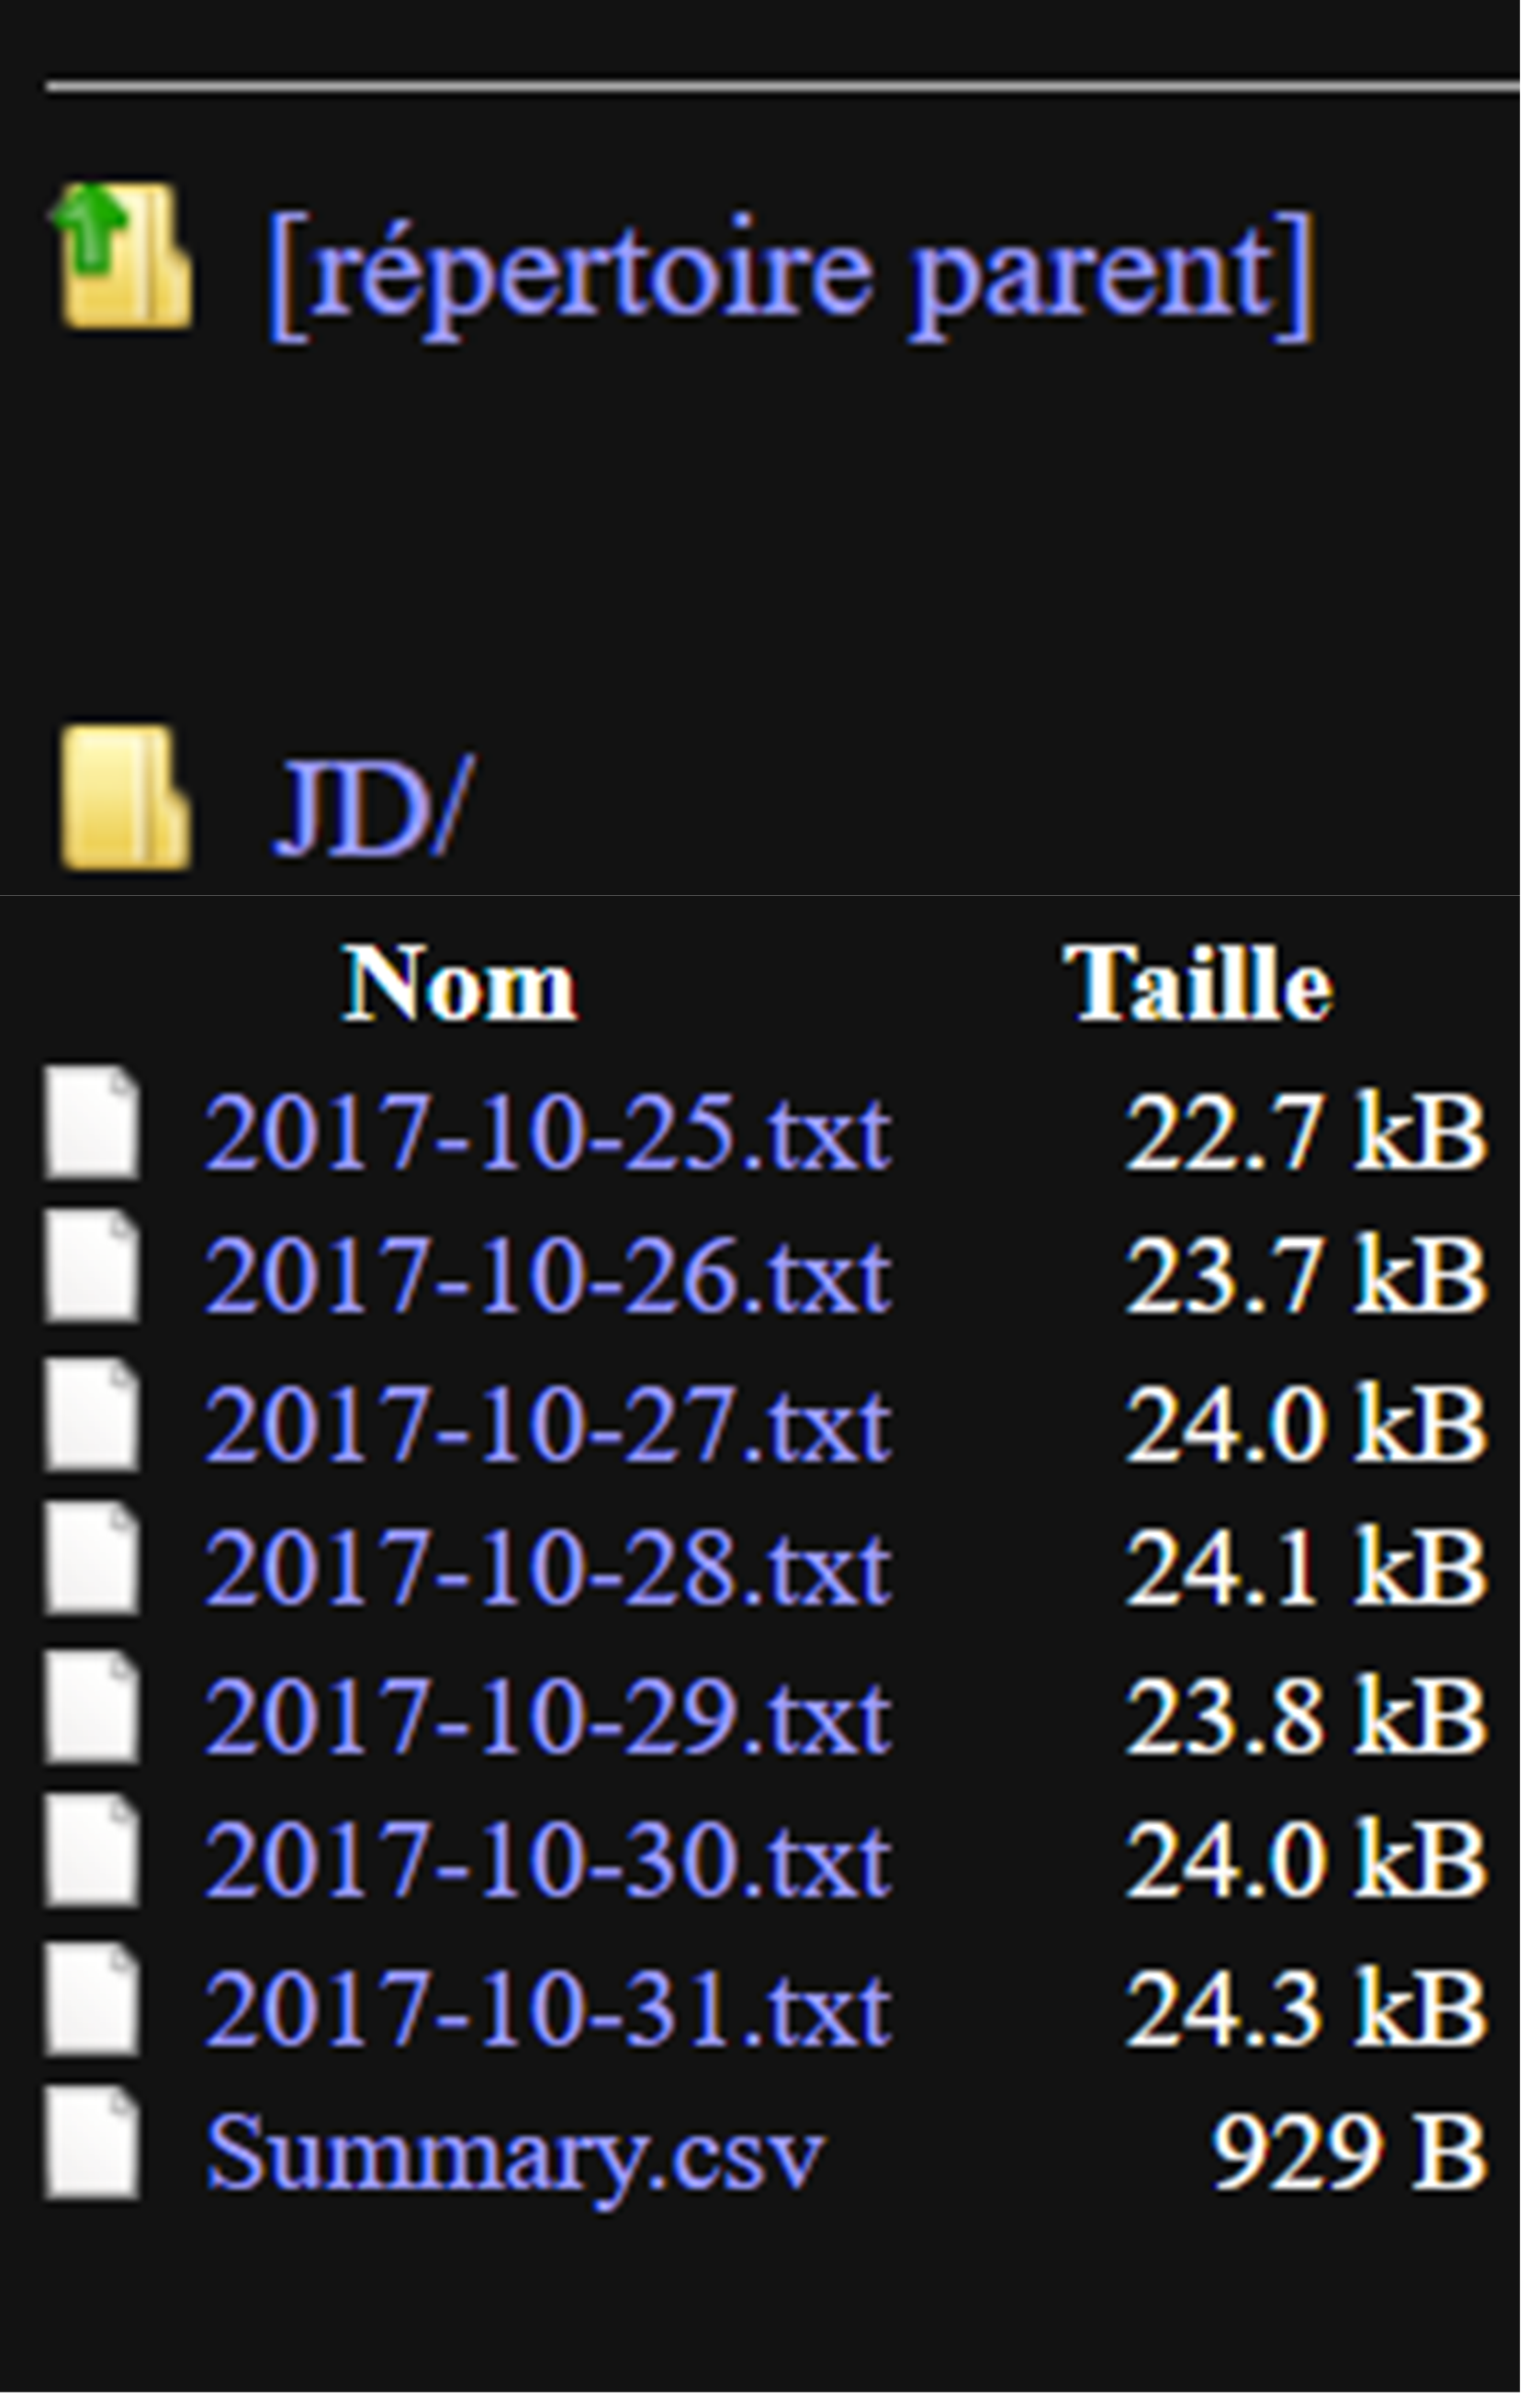
write.act
generatesStep 3: Generate Daily Reports
Once we are confident in the results of the pre-processing step, we
can generate a graphical summary to help us review and document each
segmented daily recording from Act2Daily(). Note, ActiGlobe
appends all recordings to a single PDF file.
dfList <- write.cosinor (
    Dir = "The_PATH_in_the_computer_WHERE_the_daily_recordings_will_be_stored",
    ID = "JD",
    DailyAct = dfList$Daily_df,
    Bdf = Bdf.adj,
    VAct = "Activity",
    VTm = "Time"
)